Reporting Multiple Regressions in APA format – Part Two
And so, after a much longer wait than intended, here is part two of my post on reporting multiple regressions. In part one I went over how to report the various assumptions that you need to check your data meets to make sure a multiple regression is the right test to carry out on your data. In this part I am going to go over how to report the main findings of you analysis. Hopefully this one won’t be as long as part one as this is fairly straight forward. Right, let’s get on with it shall we.
The first thing to do when reporting results is to describe the test you carried out and why you did it. You need to make sure you mention the various variables included in your analysis. Something like this:
A multiple regression was conducted to see if intelligence level and extroversion level predicted the total value of sales made by sales persons per week.
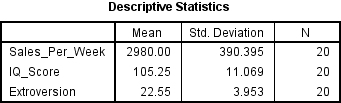
Next you want to have a look at the various descriptive statistics you have. Now to be honest it is up to you where and how you report these. They can go in a table or in text and can be mentioned before or during your main analysis. How you do it generally depends on how many variables you have. One or two, just stick it in the text, more than that and you should make a table. Now you can just report the means and standard deviation values, as seen in the table below. However, if you really want your data to be complete you will need to include the bivariate correlation values, and that means running some extra tests. Now I am not going to show you how to do that here, I may in a future post, as for now I want to focus on the main findings. I will say that if you do want to include these values then you need to run individual correlations on all your predictor variables against your dependent variable individually. Then you report the R value and the significance value for each one.
Right, so once you have reported the various descriptive statistics the next thing you want to do is look and see if your results are statistically significant. When you run a multiple regression, it automatically includes an ANOVA (ANalysis Of VAriance) test in the mix. This is the first thing you want to look for.
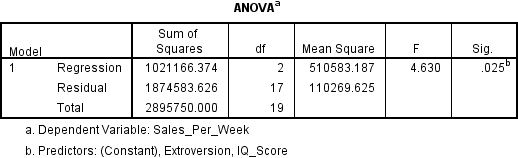
If the significance value is less than .05 then you have yourself a finding that is statistically significant. When it comes to reporting it you will want to include the F value and the relevant degrees of freedom. You need to report the degrees of freedom for both the regression and the residual error. Next you want to look and see how much of the variance in the results your analysis explains. For this you want to turn to the Model Summary table.

The R Square value tells you how much of the variance in your analysis is explained by the various predictor variables. In this case it is .353, or to put it another way 35.3%. You also need to look at the Adjusted R Square value as well. This value takes into account the number of variables involved in your analysis. If you add additional variables to the analysis the R Square value will tend to increase, however it will never decrease. The Adjusted R Square value on the other hand can go down if the new variable doesn’t add to the explanatory power of the model. It is now standard practice to include this value when reporting your results. So let’s do that:
NOTE: In part one we used the Enter method to add the variables to the analysis. You should mention this when reporting your findings.
Using the enter method it was found that intelligence and extroversion level explain a significant amount of the variance in the value of sales made per week (F(2, 17) = 4.63, p < .05, R2 = .59, R2Adjusted = .28).
So is that it then? I mean we know that we have significant results, surely we can call it a day? Well not quite. We know that overall our results were significant but we don’t know whether one or both of our predictor variables is contributing to this result. To find out we need to look to the Coefficients table.
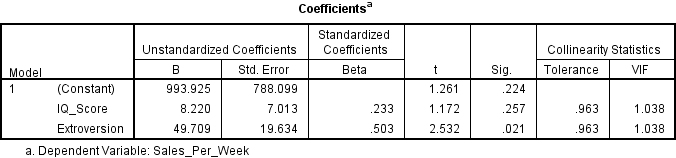
Here we will see that SPSS has kindly carried out a couple of t tests for us, one for intelligence/IQ score and one for extroversion level. Again we look to see which, if any, of these are significant, and we see that intelligence is not but extroversion level is. You also need to look at the Beta value. This will tell you if your regression is positive or negative for this variable. No whether you say which direction the regression is heading here is up to you, I generally leave this detail until the discussion section, but either way stick that Beta value in there. Ok, so let’s report this.
NOTE: I believe that the degrees of freedom for the t tests in this analysis is n-1, but I am not completely sure. Make sure you check with someone who does this sort of thing for a living before handing anything in. Also you should use the symbol for Beta rather than the word if possible.
The analysis shows that intelligence level did not significantly predict value of sales per week (Beta = .23, t(19) = 1.17, ns), however extroversion level did significantly predict value of sales per week (Beta = .50, t(19) = 2.53, p < .05).
And that’s really it. It never hurts to throw in a graph if you can but generally that is all the information you need to report for a multiple regression. I hope these posts have been helpful. Be sure to check anything I have said with your lecturers as, like I said right at the beginning, I only just worked this all out myself so you probably shouldn’t be putting all your faith in me. Good luck and may all your results be significant.
UPDATE 19/03/2015 – So the degrees of freedom reported for the above t-test are wrong, thanks to Grayden for pointing that out. As such I have written another post telling you what they should be. Please go check that out and please let me know if I have made any other mistakes.
Leave a Reply